In this useful overview, we will explain how to understand the results of your Google Business Profile Audit report.
If you prefer to learn by watching videos, check out our free course in BrightLocal Academy that shows you how to set up and understand Google Business Profile Audit report 👇
A GBP Audit will look like this, once complete:
You can find the report by clicking 'SEO Tools' in the top navigation bar, then selecting 'Google Business Profile'. It is also accessible from the Location’s sidebar menu.
1. Summary tab
When the GBP Audit is first opened, you will see the 'Summary' tab — this shows data pulled in from your Google Business Profile account.
In the top right, you can see the selected search location ('Charlotte' in the example below):
Directly beneath the search location, you will also see the date when the report was last run.
Business Details
The first section shows all of the Business Details from the GBP, as illustrated below.
This contains the following information:
NAP Data: The name, address, and phone number is displayed here. It also shows the website and chosen business category — all of this is critical information to be aware of within the location’s GBP account.
Opening Hours: It is important for local businesses to keep these times correct and accurate.
Photos: This shows how many photos are being displayed on the GBP account.
Reviews
Underneath the Business Details section, you’ll see a number of different tabs — the first of which is ‘Reviews’. The report will show this information by default.
This tab displays the total number of reviews on the GBP account, and also gives the average star rating.
The table below shows the five most recent reviews, including:
- The feedback left from the reviewer
- The date when the review was left
- The star rating
The green ‘View Review’ button links to the actual review, enabling you to see the feedback in its entirety.
Duplicates
This section will flag if any duplicate GBP accounts have been detected for this location — if they have, it will show the following information:
- Name
- Address
- Phone number
- Whether the profile is verified
- The website URL
You also have the option to add an Action, if needed.
NAP Comparison
This table compares the name, address, and phone number used on your Google profile with the details supplied to us when the report was set up — thereby helping you to keep NAP data consistent, which is an important part of Local SEO.
It’s worth mentioning that if you're a service-area business because you won’t be displaying your address in your GBP but you’re required to add it to set up your BrightLocal Location, this will likely be flagged as an error in the ‘NAP Comparison’ section. There’s no need to correct this error, just make sure that the information you’re displaying in your GBP is correct because that’s what searchers will see when they’re looking for your services.
Other Ranking Factors
Additional local ranking identifiers on your Google profile and your website are included within this table — these are considered to be among the most important local search ranking factors. See the 2018 Local Search Ranking Factors survey.
We ask these key questions:
'Is phone number a local number?'
Having a local number (if possible) is beneficial for Local SEO.
'Is city name / 'state code' used in landing page ‘title’ tag?'
Having a specific location in the title tag has been proven to help Local SEO.
The results from these questions are included in the table, letting you investigate further (if desired):
2. Keyword tabs 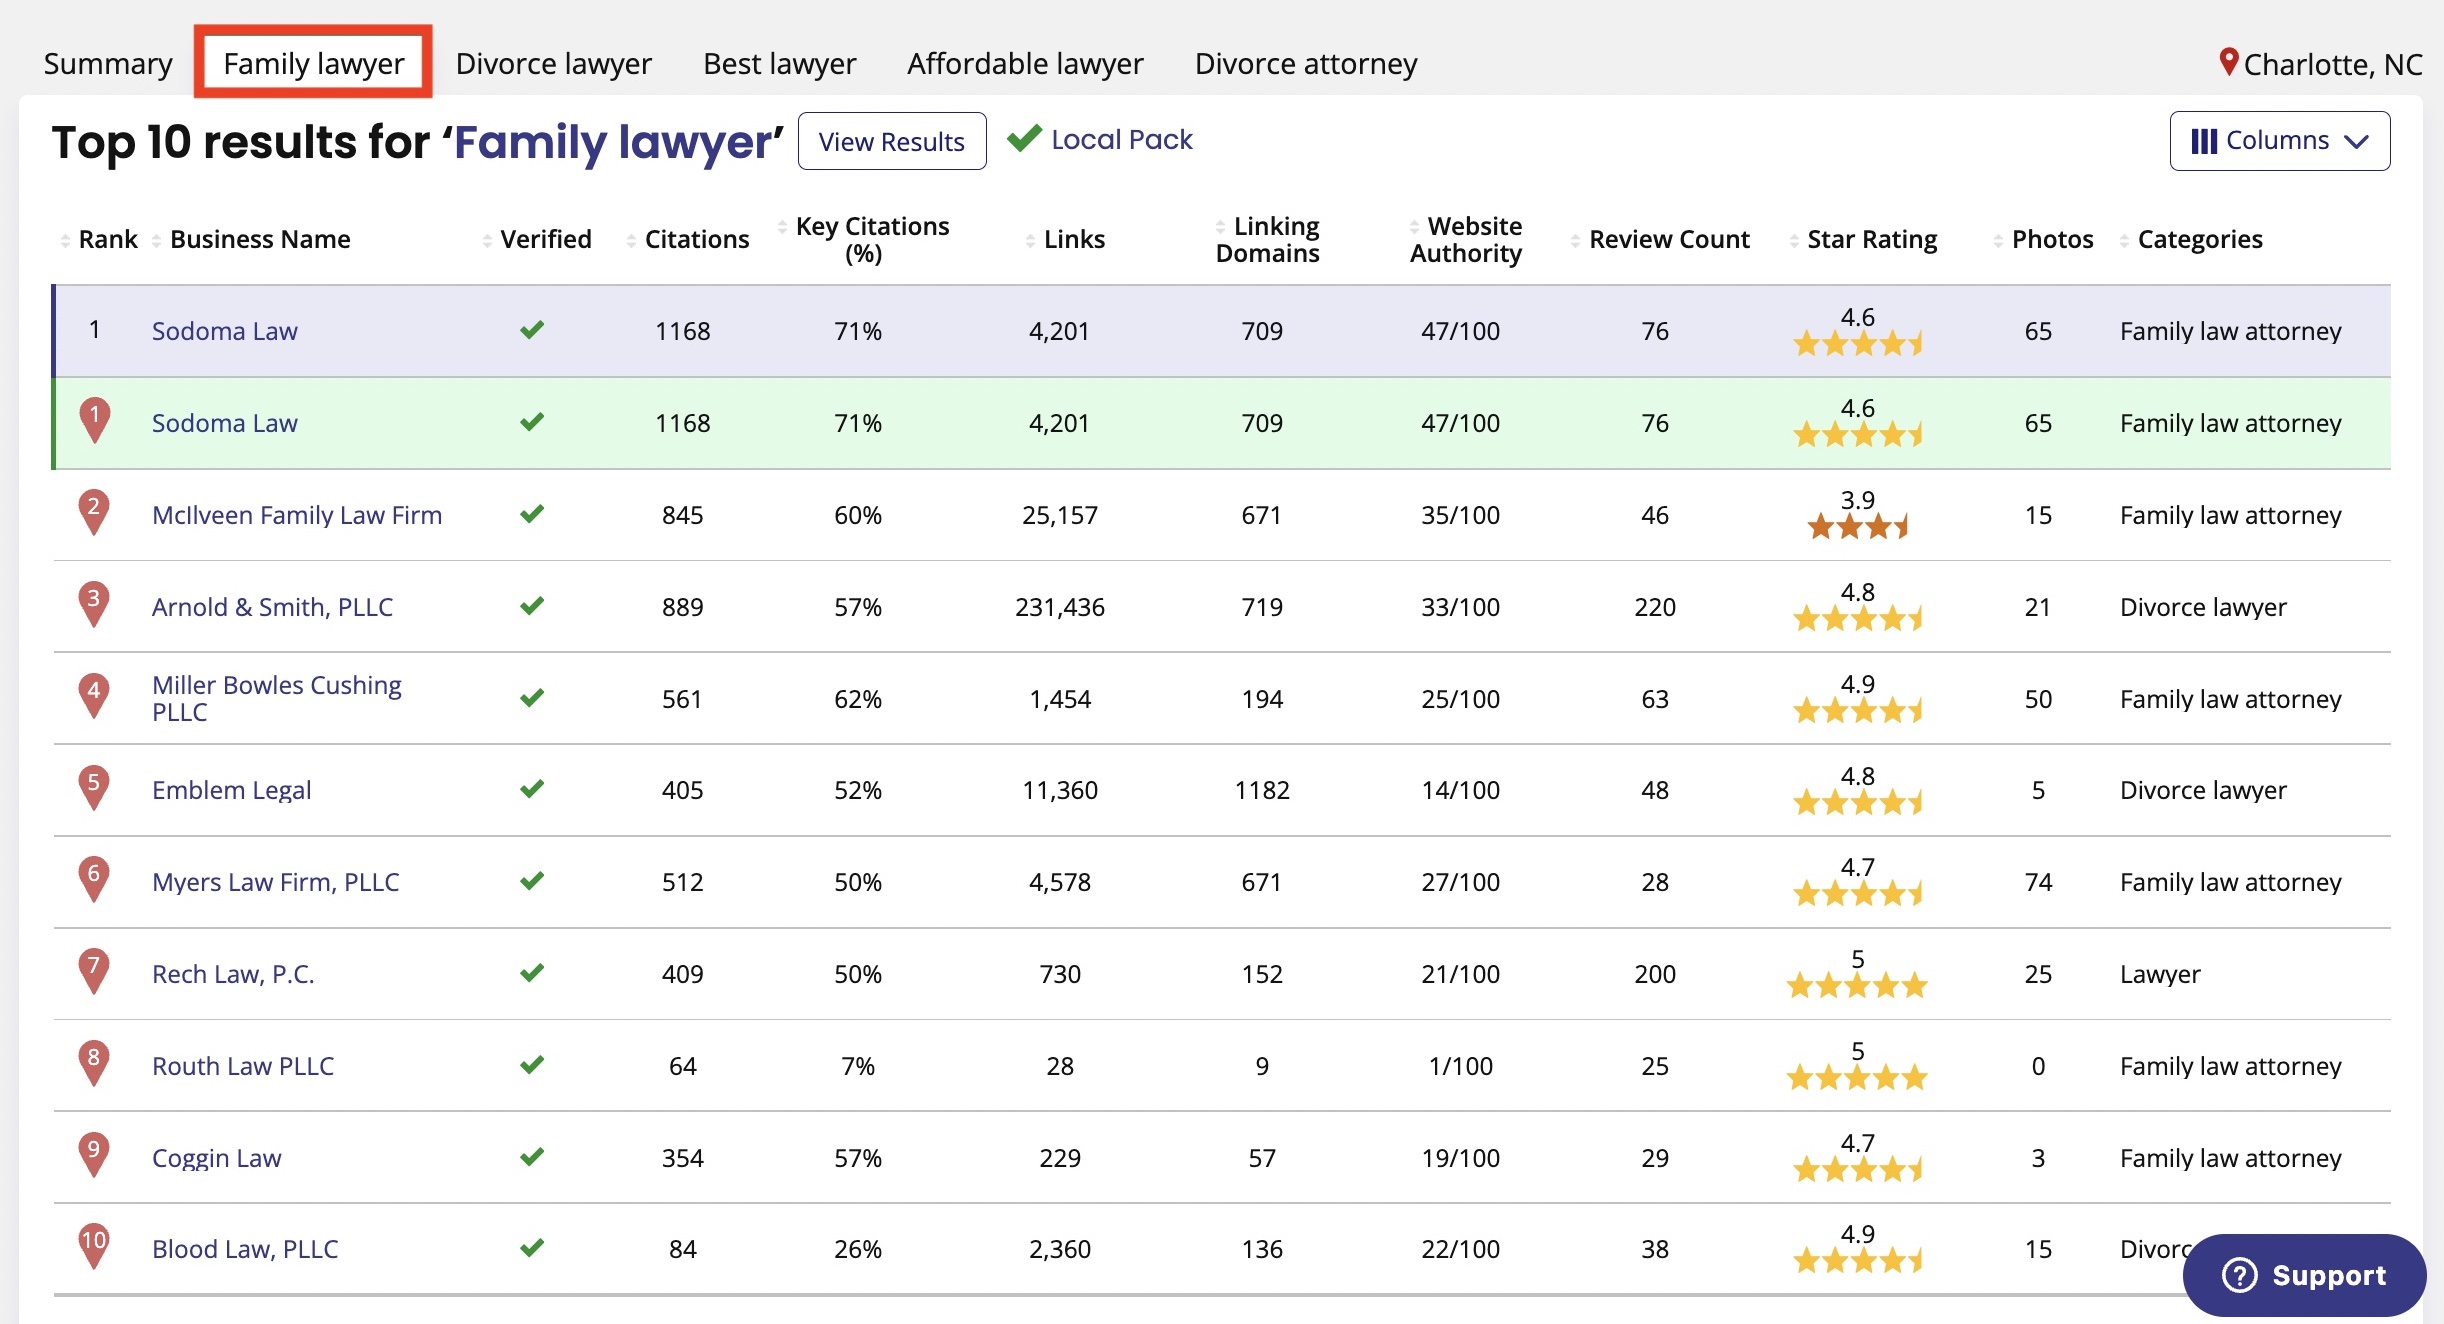
Each keyword that's added in the report’s settings will have its own tab here, and each tab will provide the same types of information for each keyword, as follows:
Keyword table
We display a table of the top 10 companies that are ranking for each keyword in your chosen search location.
The location that's the subject of the report will always be at the top of this list, helping you to compare its performance to those within the top 10.
View Results button: You'll see this button at the top, next to the keyword — this shows you a popup where you can view the search results for this particular keyword.
Rank: This shows where the business is ranking for the keyword and search location.
Business Name: This displays the business name, as it appears on the GBP account.
Verified: A green tick or a red cross will be shown here, depending on if it's a verified GBP account.
Citations: This pulls in citations using Google to identify listings, and performs a real-time lookup of citations each time the report runs — it will not match the Citation Tracker report, as that has a far more complex and dedicated process for identifying citations, which uses an extended list of searches, APIs, and filters. The Citation Tracker also stores and reuses citations from one report run to the next, rather than performing a fresh citation lookup every time.
Top Citations: This shows the percentage of 'top citations' (having more value) that are found within all citations discovered.
Links: This displays the number of links found on the website listed under the GBP account — if this is very high, it usually means they have connected their Facebook page or another social media page. We gather this data through Moz.
Linking Domains: The total linking root domains count taken from Moz.
Website Authority: Authority score is similar to ‘Page Rank’ and is a measure of the website's ‘rankability’ that considers over 150 different SEO signals; the greater the Authority score, the higher the potential ranking of a website.
Majestic C-Flow: Citation-Flow is a link-related score provided by MajesticSEO, and is calculated based on the volume of inbound links that a site has; more links = higher C-Flow score.
Review Count: The number of reviews found under this GBP are shown here.
Star Rating: This is the average star rating of all reviews under the GBP.
Photos: This figure represents the number of photos found against the GBP.
Categories: The main category under the GBP.
If needed, you can filter out any of these columns by clicking the ‘Columns’ dropdown menu.
Just select or deselect any checkboxes, as desired, then click the green ‘Update Table’ button.
3. Add Google Insights
Click the green 'Add Insights’ button (highlighted above with the red box) to connect. You’ll then see the following information:
This data is all extremely helpful when looking at your GBP, so we have located it in a single place for ease of use. You can see this information within your GBP account itself, however, we store the data for longer and allow you to look back further in time by using the date dropdown shown below within the red box:
Here is a summary of each area:
Views: This section shows how many customers discovered you via a Google search on desktop, and mobile, and a search on Google Maps desktop and mobile. To see how many people found you on a particular product on a particular day, place your cursor over the appropriate segment of the graph for your desired day.
Select the boxes to the right of the graph to turn off segments, so you can isolate particular data points that you’re interested in. For example, you might want to only look at how discovery via Google Maps changed over time. To do so, tick the box beside ‘Listing on Search’ to temporarily remove the Search segment from the graph, and only look at Maps referrals.
Actions: This section shows what customers did once they found your profile on Google. ‘Total actions’ gives the total of the following types of actions that customers took on your profile:
- Visited your website
- Requested directions
- Called you
To discover how many people took a particular action on a particular day, place your cursor over the appropriate segment of the graph for the day you're keen to see. Select the boxes to the right of the graph to turn off segments, so that you can isolate particular data points that you're interested in.
Phone calls: This section shows when customers called your business via your Google profile. At the top of the section, ‘Total calls’ gives the total number of phone calls in the timeframe that you’ve selected.
To learn more about optimizing and understanding a GBP with Google Business Profile Audit, enroll in BrightLocal Academy for free today.
Comments
0 comments
Article is closed for comments.